Original Link: https://www.anandtech.com/show/8370/gigabyte-am1m-s2h-review
GIGABYTE AM1M-S2H Review: What Can $35 Get You?
by Ian Cutress on August 15, 2014 3:00 PM EST- Posted in
- AMD
- Gigabyte
- Motherboards
- Kabini
- AM1
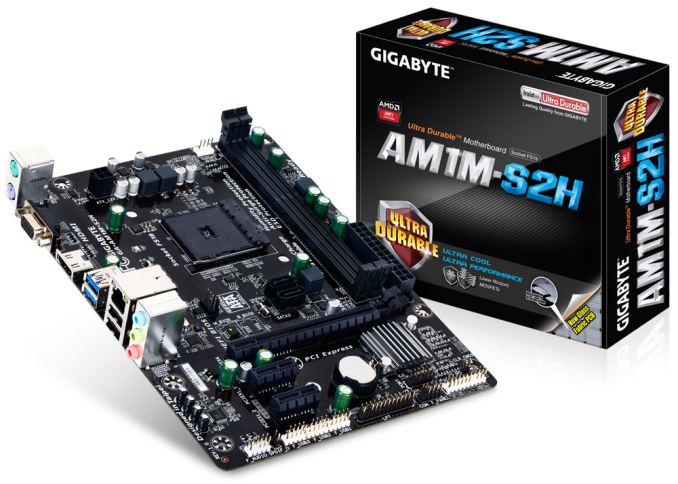
While most of the time enthusiasts are playing around with the latest and greatest, the cheaper low performance platforms are usually the high volume movers. As we explained in our Kabini review, AMD has taken the unusual step of producing an upgradable platform for as little as $74. The motherboards for the AM1 Kabini platform range from $31 to $47, and today we are reviewing the GIGABYTE AM1M-S2H which retails at $35.
GIGABYTE AM1M-S2H Overview
Perhaps it is just me, but a motherboard for $35 seems almost unreal. If we consider any markup by the retailer, the per-IC margins must be very minimal indeed, unless the manufacturers were selling everything at cost in order to get an idea off the ground. The AM1 range varies from $31 to $47, or $59 if you consider the one motherboard that supports a 19-volt DC-In, but they are all in either the mini-ITX or micro-ATX form factor.
The GIGABYTE AM1M-S2H falls near the bottom of that price range, although it is the larger microATX size with full-sized DDR3 support. There is no overclocking possible on this motherboard, and as such the power delivery and lack of a power delivery heatsink is suited for the low powered Kabini APUs at stock speeds. For connectivity the motherboard has three USB 2.0 headers, two SATA 6 Gbps ports, two fan headers, two USB 3.0 ports, an LPT header, a COM header, a 2.1 audio codec, gigabit Ethernet, a PCIe 2.0 x4 slot and two PCIe 2.0 x1 slots. Perhaps surprisingly, due to the low cost nature of the product, we do get GIGABYTE’s Dual BIOS here despite the increased cost to the manufacturer. When I have previously met with GIGABYTE, the product managers in the motherboard business unit insisted that Dual BIOS is a great feature no matter the price of the motherboard; as an enthusiast, I would agree.
The AM1M-S2H formed the backbone of our Kabini review, which it performed without incident. The full length PCIe slot affords use of a full sized graphics card and perhaps unsurprisingly the Athlon 5350 we used for testing still gave frame rates above 30 FPS with our standard gaming benchmarks and setups. Performance of the motherboard on the system side of things gave a DPC Latency and Audio results similar to what we would expect with a low powered platform/ALC887 audio codec, similarly with boot times. USB speeds are slightly slower than the mainstream platforms, but still within a few percentage points.
The whole focus of Kabini is for the system to be upgradable. AMD has aimed the platform for low powered use (digital signage, library computers) similar to Intel’s Atom but aim to offer faster DRAM support, upgradability and price competitiveness. The AM1M-S2H certainly hits on that last point, although the depth of the system will rely on whether AMD will refresh the Beema line for the same socket.
Visual Inspection
The AM1 platform uses the FS1b socket, which unlike the AM3+ or FM2 sockets is a nice square shape which allows for a better orientation of CPU coolers and brackets. The socket only uses two holes for push-pin connectors, and in our testing the CPU cooler that comes with the APU in the box works fine at stock speeds. There are very few aftermarket FS1b CPU coolers to choose from, although the distance to any other features on the motherboard should not make this much of an issue.
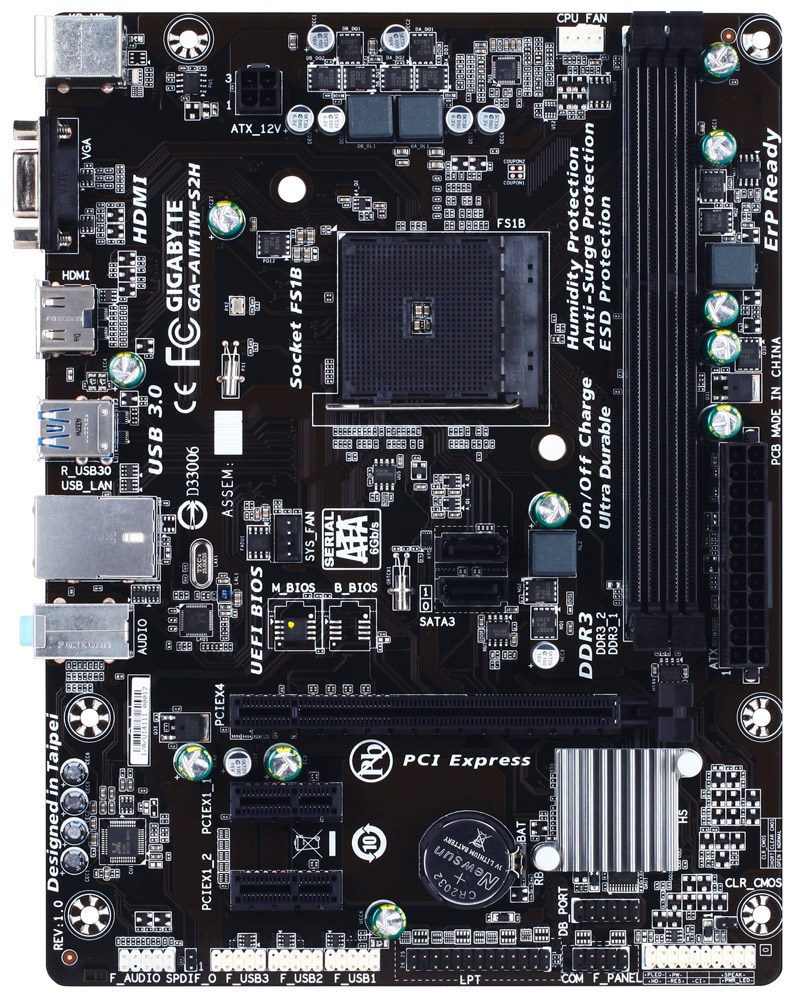
The 4-pin ATX power connector is well away from the socket, meaning that cables need not be stretched over the motherboard for attachment – such is the benefit of mATX over some mini-ITX designs. The two-phase power delivery has no heatsink, and the two CPU fan headers are at opposite corners of the socket. The 4-pin CPU fan header in white is to the top right of the socket and the 4-pin SYS header is to the bottom left, above the PCIe slots. Near this latter fan header are the two BIOS chips for GIGABYTE’s dual BIOS which makes an appearance here despite the added cost for the manufacturer.
To the bottom right of the socket is the two SATA 6 Gbps ports. Being right in the middle of the motherboard is a rather odd place for SATA ports. I understand that cheaper products have the connectors coming out of the motherboard, but having them here is a little silly. It means that any user who wants to have a SATA device (which will be anyone not booting from USB) will have to place the cable over half the motherboard to reach – not a good design plan.

The DRAM slots use a double sided latch mechanism and hide no extra controllers around the perimeter. Because the Kabini platform uses an on-die Fusion Controller Hub for IO, the heatsink in the bottom right is for the SuperIO IC dealing with extra connectivity or any PCIe lane management. For this price there are no power/reset buttons, nor a two-digit debug display, but we do get a COM header and an LPT header as well.
This motherboard does have three USB 2.0 headers at the bottom, which is perhaps a little odd but allows system manufacturers to design cases around the IO depending on the request of their clients. Next to these is the audio side of the motherboard which uses a Realtek ALC887 2.1-channel codec – users needing the ALC892/898 will have to look for a more expensive motherboard.

The rear panel contains separate PS/2 connectors for a mouse and keyboard, a D-Sub video output, HDMI, two USB 3.0 ports, two USB 2.0 ports, a Realtek network interface and audio jacks. Given the use case for this platform, perhaps a ClearCMOS button would have not been warranted, even though I like to see them on home systems.
Board Features
| GIGABYTE AM1M-S2H | |
| Price | US (Newegg) |
| Size | mATX |
| CPU Interface | Socket FS1b |
| Chipset | AMD AM1 |
| Memory Slots |
Two DDR3 DIMM slots supporting up to 32 GB Single Channel, 1333-1600 MHz |
| Video Outputs |
VGA HDMI |
| Onboard LAN | Realtek |
| Onboard Audio | Realtek ALC887 |
| Expansion Slots |
1 x PCIe 2.0 x4 2 x PCIe 2.0 x1 |
| Onboard SATA/RAID | 2 x SATA 6 Gbps |
| USB 3.0 | 2 x USB 3.0 (Back Panel) |
| Onboard |
2 x SATA 6 Gbps 3 x USB 2.0 Headers 1 x LPT Header 1 x COM Header Front Panel Audio Front Panel Header 2 x Fan Headers |
| Power Connectors |
1 x 24-pin ATX 1 x 4-pin CPU |
| Fan Headers |
1 x CPU (4-pin) 1 x SYS (4-pin) |
| IO Panel |
1 x PS/2 Keyboard Port 1 x PS/2 Mouse Port D-Sub HDMI 2 x USB 3.0 2 X USB 2.0 1 x Realtek NIC Audio Jacks (ALC887) |
| Warranty Period | 3 Years |
| Product Page | Link |
If Kabini is all about low-cost, then it makes sense when manufacturers like GIGABYTE take advantage of deals like Realtek’s audio + network combination. Perhaps $35 for a motherboard is too low to see a USB 3.0 header, although that would either require moving the USB 3.0 ports from the rear panel or adding a controller, which would have a noticeable cost.

GIGABYTE AM1M-S2H BIOS
Unlike the mainstream platforms, one might forgive a manufacturer for not spending much time developing and optimizing a new BIOS topology for a low cost platform like AM1. Since GIGABYTE came into the graphical BIOS arena, its ‘classic mode’ has been a permanent fixture, especially for enthusiasts that find some of the newer implementations a little difficult to manipulate at speed. It is this classic mode that the AM1 platform falls back on, although the lack of CPU overclocking does strip out a number of options.
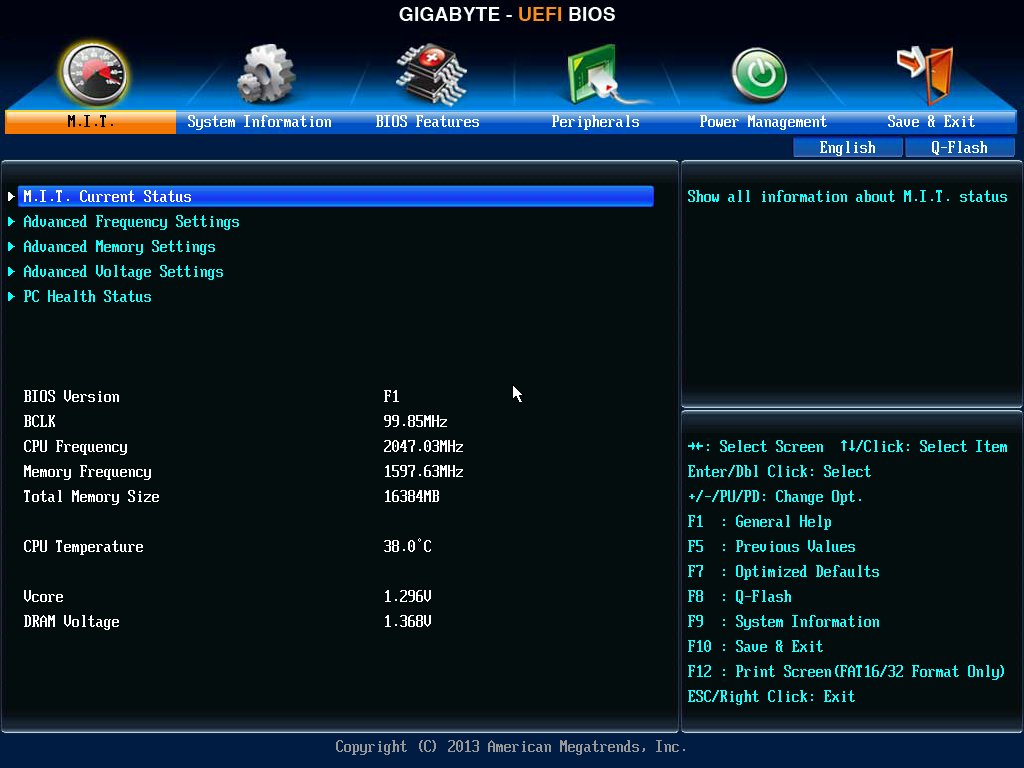
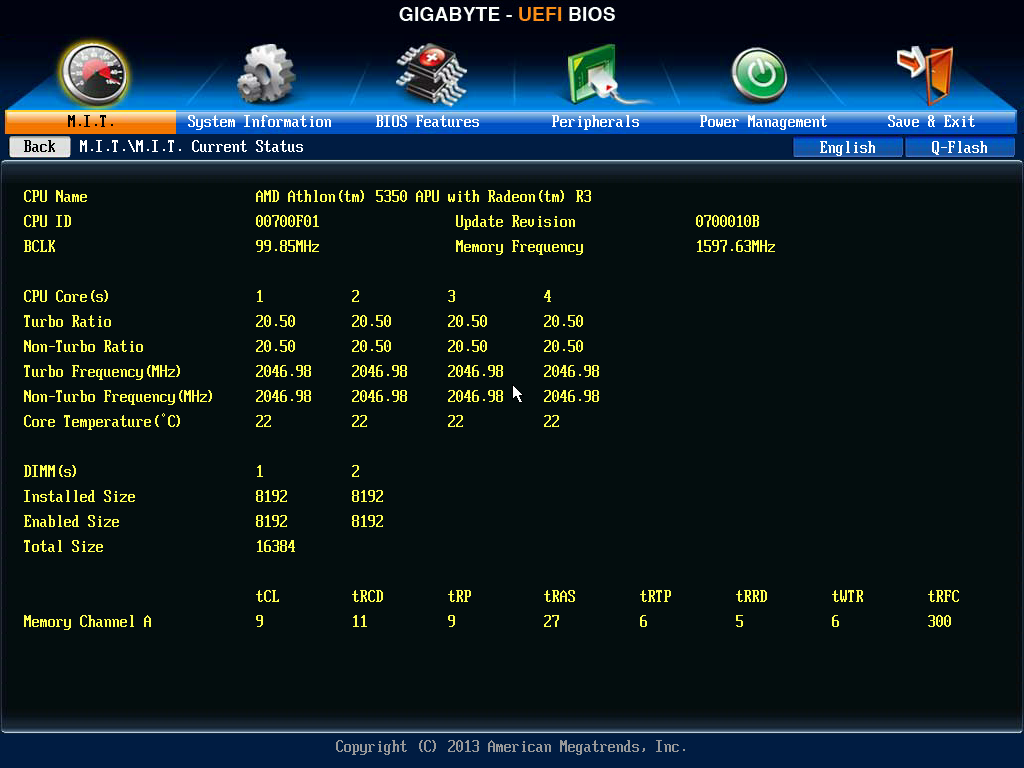
The first screen shows the BIOS version, CPU frequency, CPU temperature, DRAM size, DRAM speed and voltages, although the most poignant information is not here: what motherboard am I looking at and what CPU is installed. This is a perennial problem for the classic mode, which is rather surprising given that the Current Status option here displays at least the CPU used:
While the motherboard has the standard overclocking menus, there is little to actually overclock. In the Advanced Frequency Settings, we were unable to adjust the North Bridge frequency or the CPU Clock Ratio above stock settings:

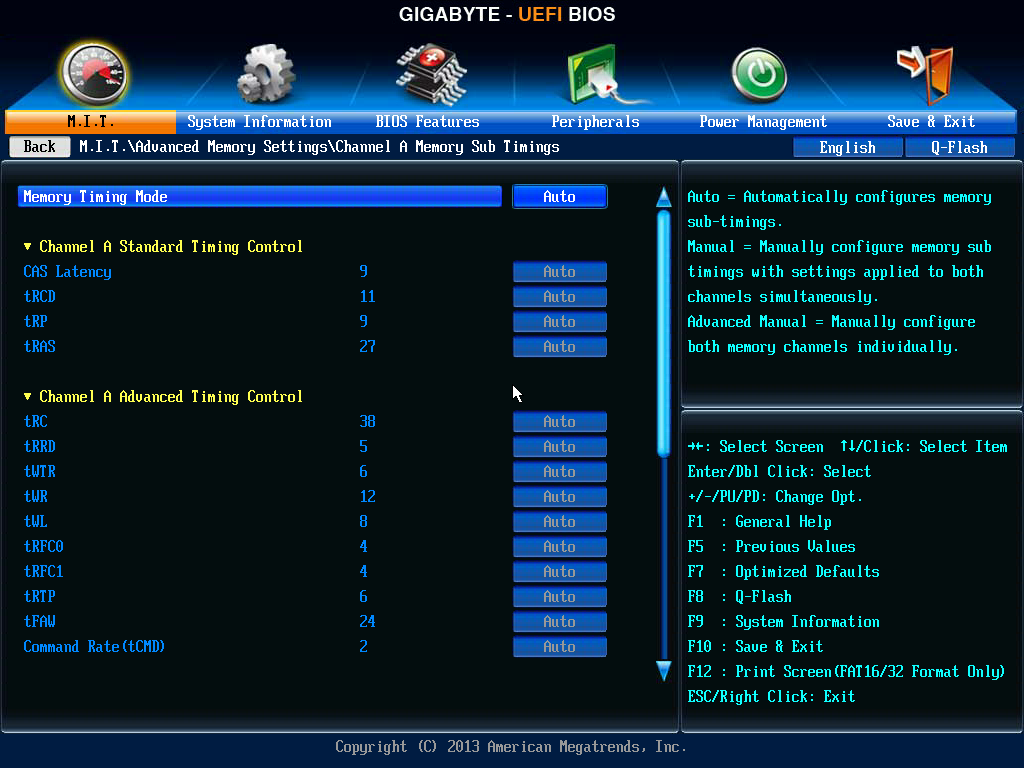
XMP modes are supported up to DDR3-1600 MHz, although the sub-timing options later in the BIOS can help with some extremely tighter timing kits (such as DDR3-1600 C7).
So while there are no direct overclocking options, users can adjust the CPU, NB and DRAM voltages should they want to make the system as low-power as possible:

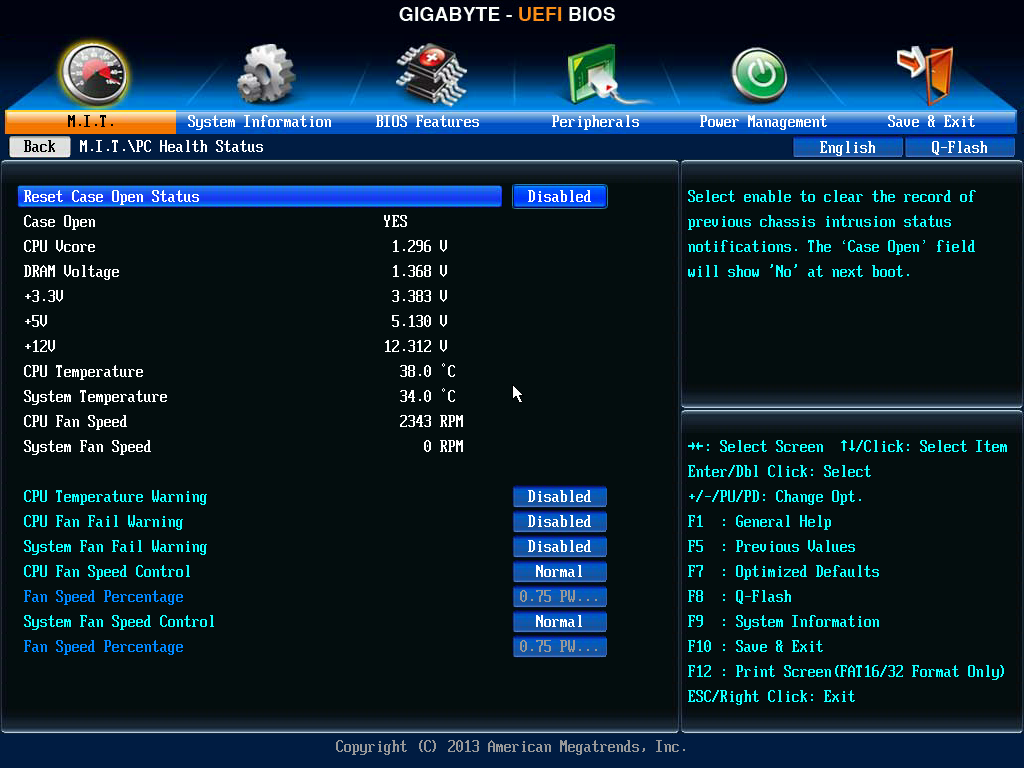
The PC Health Status menu is where the fan options are, although because this is GIGABYTE’s classic mode, these options are limited to a strange scale of ‘PWM / ºC’. What this means is how the fan power is adjusted according to the temperature, and as such a setting of 2.50 PWM/ºC will cause higher fan speeds as the system warms up than a setting of 1.25 PWM/ºC. This scale is not linear in performance, as the rotational speed of the fan is not directly proportional to the power across the whole range.
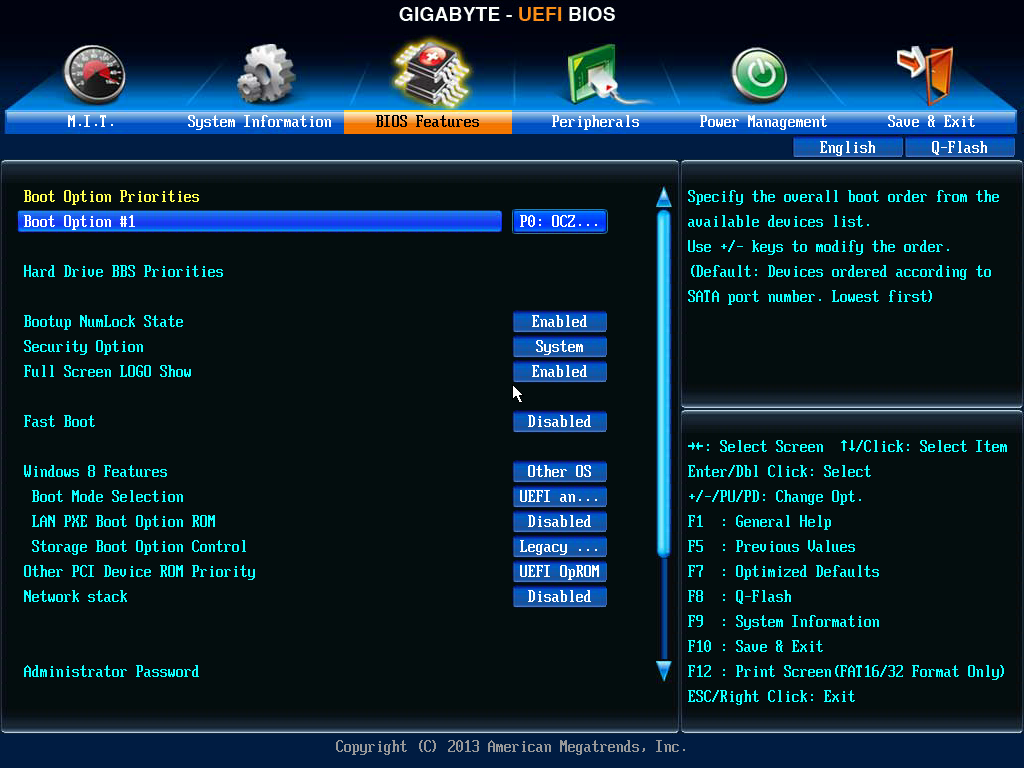
The BIOS Features tab gives options for Fast Booting into Windows 8 as well as adjusting the boot order.
The Peripherals section has fewer options than we are accustomed to due to the lack of extra controllers on the motherboard, however the audio/NIC/USB ports can be adjusted here, as well as the SATA configuration (IDE/AHCI) and the GFX options.

The final Save and Exit tab gives options for Boot Override or BIOS profiles:


GIGABYTE AM1M-S2H Software
In perhaps the same way that the AM1 BIOS is not up-to-date with the latest implementation, neither is the software. On GIGABYTE’s mainstream Intel platform at least, the options are all tied into a new interface and each iteration gives more features and functionality. With AM1, we are back with EasyTune 6 with its limited capabilities.
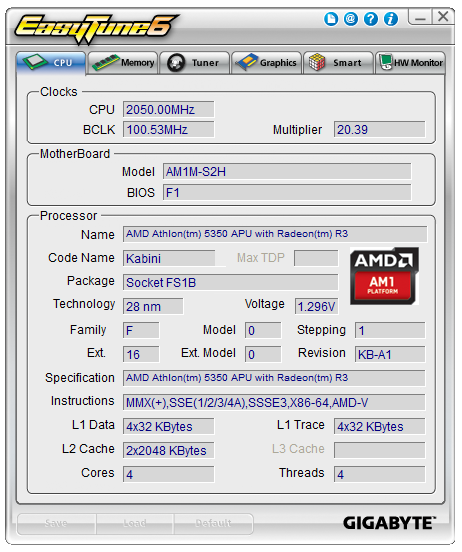
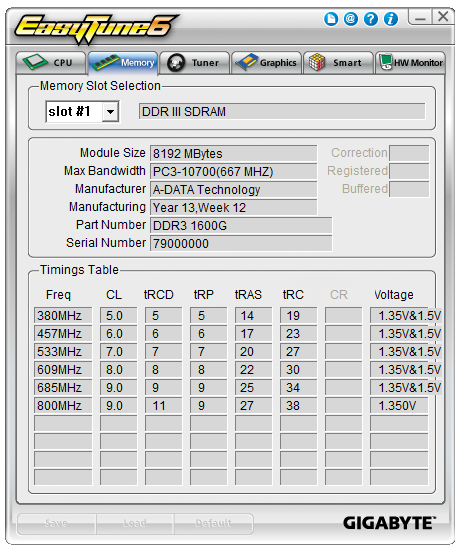
Because there is no overclocking on this motherboard, ET6 plays more of an informative role for the most part, letting us know which motherboard, CPU, DRAM and GPU are in play.
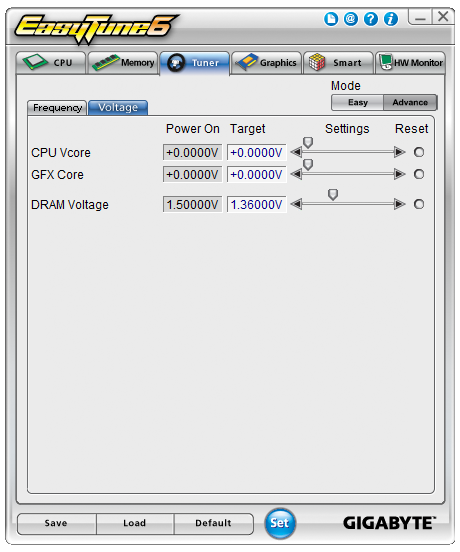
The Tuner section offers a little bit of modification, especially if the user wants to overclock DDR3-1333 memory to DDR3-1600:

The voltage options from the BIOS are also present for any user wishing to underclock and save power.
The basic EasyTune fan controls are here, offering a two point gradient for both fan headers.

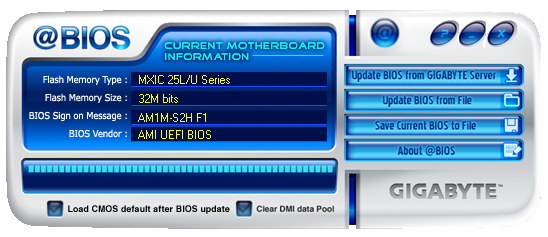
Because there was no way to update the BIOS through EasyTune when it was made, GIGABYTE developed @BIOS to perform the operation:


GIGABYTE AM1M-S2H In The Box
Despite all the talk earlier in the review about how low cost motherboards and the motherboard manufacturers are dealing with extremely low margins, imagine developing a motherboard for that budget then being told that some extras have to be put into the box. Now I admit the usual extras we get in the box (SATA cables, IO shield) are bought in immense bulk, but even these have a tangible bill-of-materials cost, even if it comes in at a few cents each. If one SATA cable cost 3.5 cents, that is 0.1% of the cost – double if two are added. I suspect that the thick, multi-language manuals cost north of $0.50 each to produce as well, so this might be stripped down to compensate. When margins are quibbling over cents, we should not expect many extras.
In the AM1M-S2H, we get the following:
Manual
Driver Disk
Rear IO Shield
Two SATA Cables
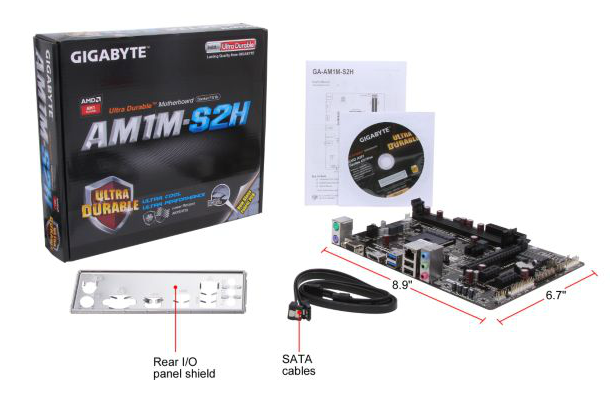
As expected, not much but enough to get a user started if purchasing OEM storage/ODD.
Many thanks to...
We must thank the following companies for kindly providing hardware for our test bed:
Thank you to OCZ for providing us with PSUs and SSDs.
Thank you to G.Skill for providing us with memory.
Thank you to Corsair for providing us with an AX1200i PSU and a Corsair H80i CLC.
Thank you to MSI for providing us with the NVIDIA GTX 770 Lightning GPUs.
Thank you to Rosewill for providing us with PSUs and RK-9100 keyboards.
Thank you to ASRock for providing us with some IO testing kit.
Test Setup
| Test Setup | |
| Processor |
AMD Athlon 5350 Quad Core, 2.05 GHz |
| Motherboards | GIGABYTE AM1M-S2H |
| Cooling | Stock Cooler |
| Power Supply | OCZ 1250W 80 PLUS Gold |
| Memory | ADATA XPG V1.0 2x8GB DDR3L-1600 9-11-9 |
| Memory Settings | XMP |
| Video Cards | MSI GTX 770 Lightning |
| Video Drivers | NVIDIA 337.88 |
| Hard Drive | OCZ Vertex 3 240 GB |
| Case | Open Test Bed |
| Operating System | Windows 7 64-bit SP1 |
| USB 2/3 Testing | OCZ Vertex 3 240 GB |
System Benchmarks
Power Consumption
Power consumption was tested on the system while in a single MSI GTX 770 Lightning GPU configuration with a wall meter connected to the OCZ 1250W power supply. This power supply is Gold rated, and as I am in the UK on a 230-240 V supply, leads to ~75% efficiency > 50W, and 90%+ efficiency at 250W, suitable for both idle and multi-GPU loading. This method of power reading allows us to compare the power management of the UEFI and the board to supply components with power under load, and includes typical PSU losses due to efficiency. These are the real world values that consumers may expect from a typical system (minus the monitor) using this motherboard.
While this method for power measurement may not be ideal, and you feel these numbers are not representative due to the high wattage power supply being used (we use the same PSU to remain consistent over a series of reviews, and the fact that some boards on our test bed get tested with three or four high powered GPUs), the important point to take away is the relationship between the numbers. These boards are all under the same conditions, and thus the differences between them should be easy to spot.
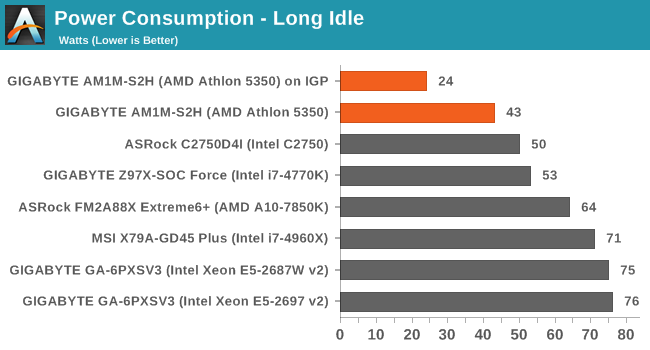
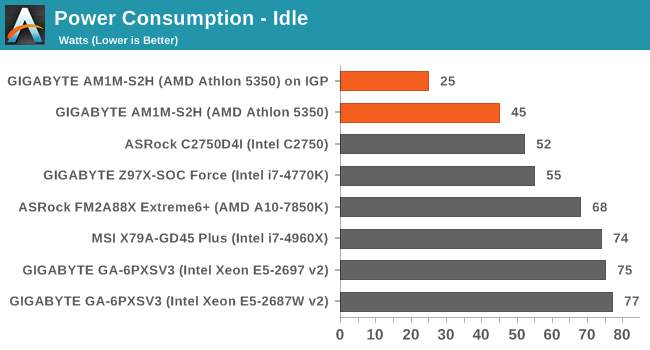
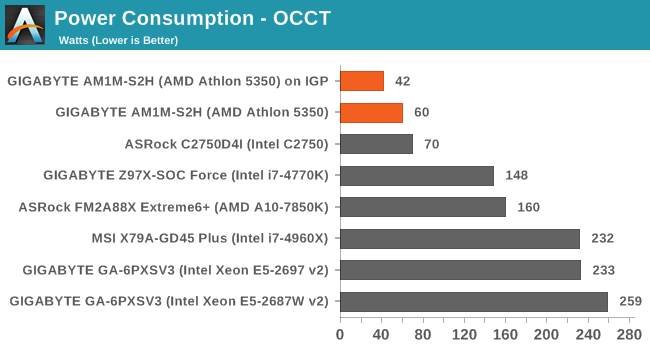
Being at the low end of the efficiency bell curve rockets our power consumption numbers, but for comparison to other platforms we have to remain consistent. Nevertheless, at full CPU load the increase in power consumption is only 17-18W. Perhaps surprisingly is the extra power consumption with the GPU installed.
Windows 7 POST Time
Different motherboards have different POST sequences before an operating system is initialized. A lot of this is dependent on the board itself, and POST boot time is determined by the controllers on board (and the sequence of how those extras are organized). As part of our testing, we look at the POST Boot Time using a stopwatch. This is the time from pressing the ON button on the computer to when Windows 7 starts loading. (We discount Windows loading as it is highly variable given Windows specific features.)
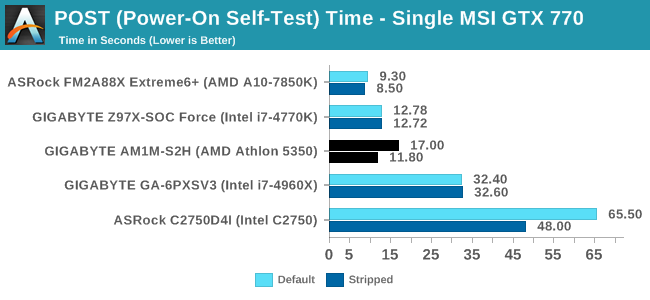
Low cost platforms are not targets for POST Time optimization, so anything under 20 seconds should be reasonable. The lack of controllers on low cost platforms should help POST times in that regard as well.
Rightmark Audio Analyzer 6.2.5
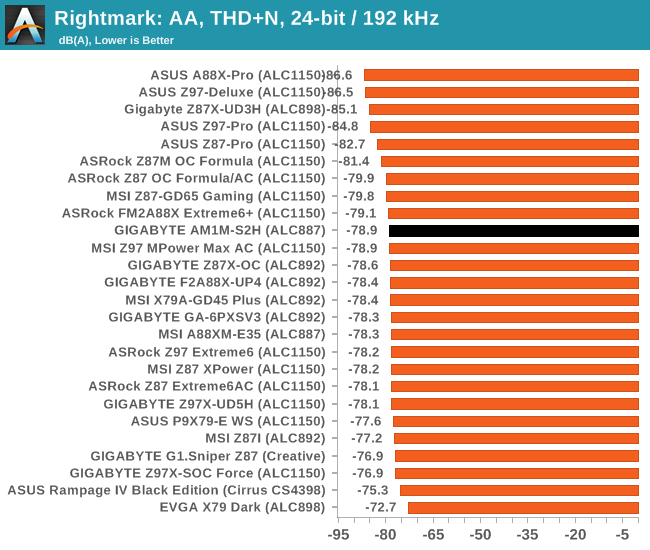
Rightmark:AA indicates how well the sound system is built and isolated from electrical interference (either internally or externally). For this test we connect the Line Out to the Line In using a short six inch 3.5mm to 3.5mm high-quality jack, turn the OS speaker volume to 100%, and run the Rightmark default test suite at 192 kHz, 24-bit. The OS is tuned to 192 kHz/24-bit input and output, and the Line-In volume is adjusted until we have the best RMAA value in the mini-pretest. We look specifically at the Dynamic Range of the audio codec used on board, as well as the Total Harmonic Distortion + Noise.
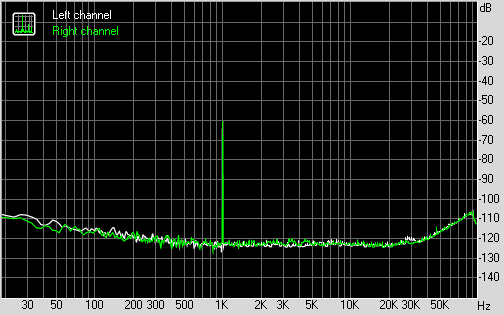
Dynamic Range of AM1M-S2H
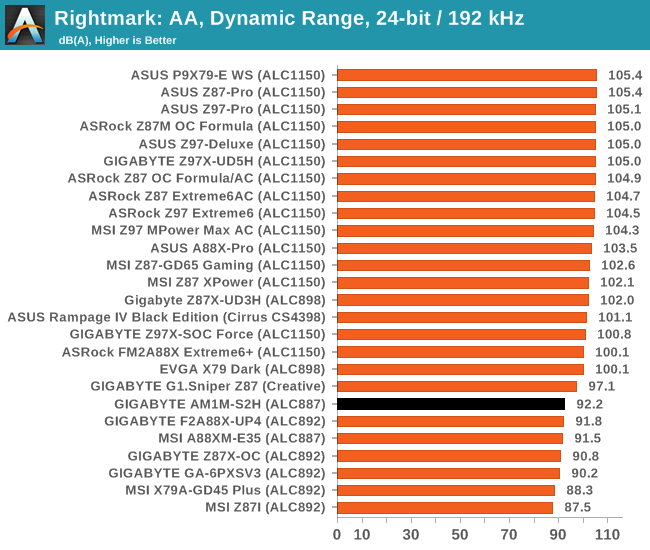
92.2 dBA is pretty much ball-park for an ALC887.
USB Backup
For this benchmark, we transfer a set size of files from the SSD to the USB drive using DiskBench, which monitors the time taken to transfer. The files transferred are a 1.52 GB set of 2867 files across 320 folders – 95% of these files are small typical website files, and the rest (90% of the size) are small 30 second HD videos. In an update to pre-Z87 testing, we also run MaxCPU to load up one of the threads during the test which improves general performance up to 15% by causing all the internal pathways to run at full speed.
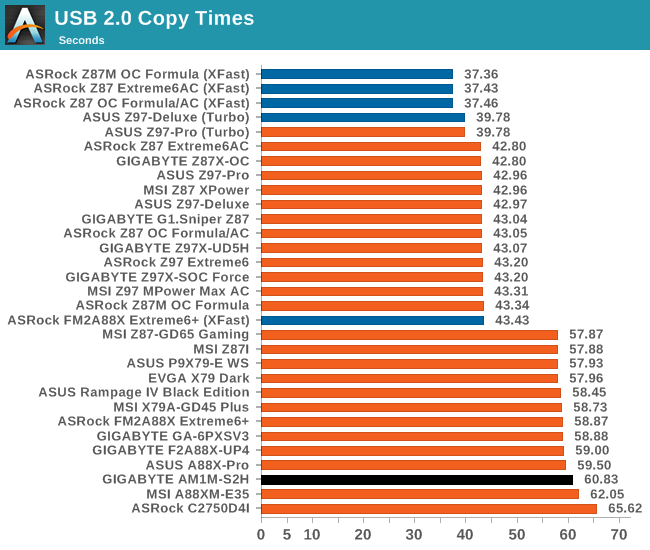
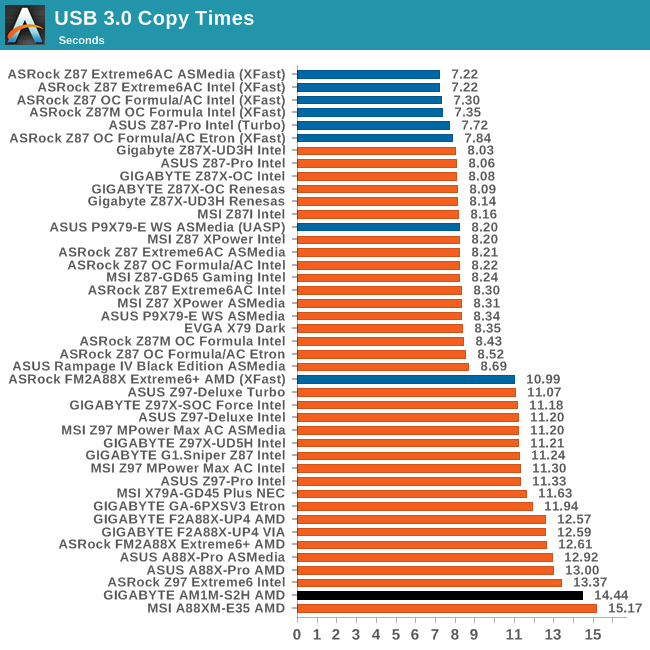
One would imagine that USB speed should be constant across any platform, especially when the standard used and base frequencies for the pathways are the same. We have seen in the past that the CPU used can have a difference in USB copy times, as well as the memory, but we try and negate that by loading up one thread during the test. For USB copy times the AM1 platform, while slower than the rest, does not perform too badly overall.
DPC Latency
Deferred Procedure Call latency is a way in which Windows handles interrupt servicing. In order to wait for a processor to acknowledge the request, the system will queue all interrupt requests by priority. Critical interrupts will be handled as soon as possible, whereas lesser priority requests such as audio will be further down the line. If the audio device requires data, it will have to wait until the request is processed before the buffer is filled.
If the device drivers of higher priority components in a system are poorly implemented, this can cause delays in request scheduling and process time. This can lead to an empty audio buffer and characteristic audible pauses, pops and clicks. The DPC latency checker measures how much time is taken processing DPCs from driver invocation. The lower the value will result in better audio transfer at smaller buffer sizes. Results are measured in microseconds.
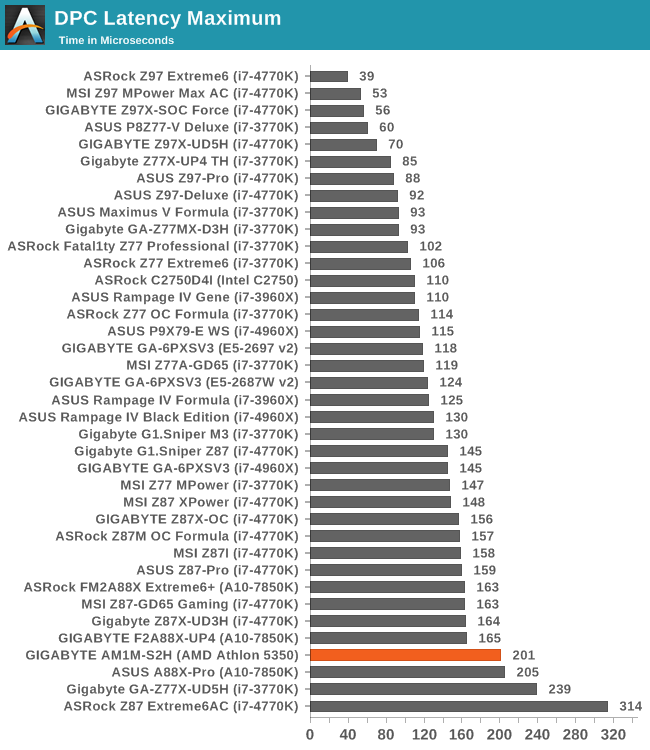
One of the good things about DPC Latency is that it seems to have become a generational improvement rather than one relying on a fast platform. It seems that the newer the platform in general, the better the DPC Latency. While 201 microseconds is on that 200 boundary we like to distinguish at the high end, compared to some bad results we have had in the past, this is great.
CPU Benchmarks
Readers of our motherboard review section will have noted the trend in modern motherboards to implement a form of MultiCore Enhancement / Acceleration / Turbo (read our report here) on their motherboards. This does several things, including better benchmark results at stock settings (not entirely needed if overclocking is an end-user goal) at the expense of heat and temperature. It also gives in essence an automatic overclock which may be against what the user wants. Our testing methodology is ‘out-of-the-box’, with the latest public BIOS installed and XMP enabled, and thus subject to the whims of this feature. It is ultimately up to the motherboard manufacturer to take this risk – and manufacturers taking risks in the setup is something they do on every product (think C-state settings, USB priority, DPC Latency / monitoring priority, memory subtimings at JEDEC). Processor speed change is part of that risk, and ultimately if no overclocking is planned, some motherboards will affect how fast that shiny new processor goes and can be an important factor in the system build.
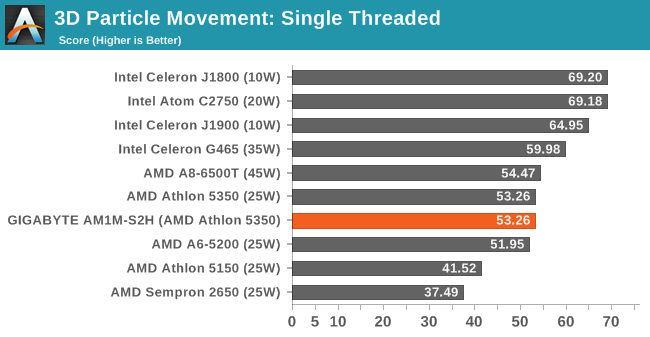
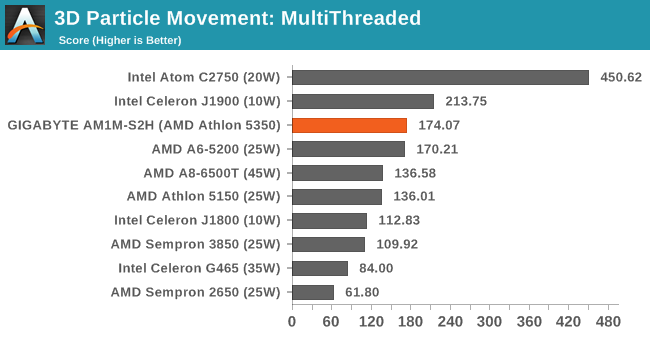
Point Calculations – 3D Movement Algorithm Test: link
3DPM is a self-penned benchmark, taking basic 3D movement algorithms used in Brownian Motion simulations and testing them for speed. High floating point performance, MHz and IPC wins in the single thread version, whereas the multithread version has to handle the threads and loves more cores.
Compression – WinRAR 5.0.1: link
Our WinRAR test from 2013 is updated to the latest version of WinRAR at the start of 2014. We compress a set of 2867 files across 320 folders totaling 1.52 GB in size – 95% of these files are small typical website files, and the rest (90% of the size) are small 30 second 720p videos.
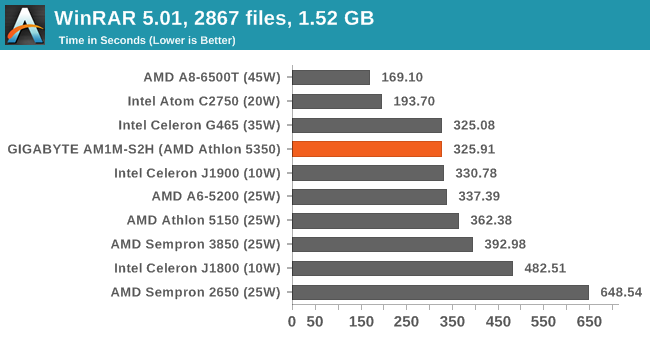
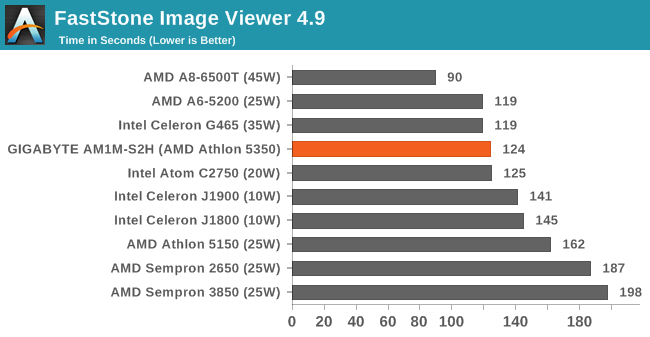
Image Manipulation – FastStone Image Viewer 4.9: link
Similarly to WinRAR, the FastStone test us updated for 2014 to the latest version. FastStone is the program I use to perform quick or bulk actions on images, such as resizing, adjusting for color and cropping. In our test we take a series of 170 images in various sizes and formats and convert them all into 640x480 .gif files, maintaining the aspect ratio. FastStone does not use multithreading for this test, and thus single threaded performance is often the winner.
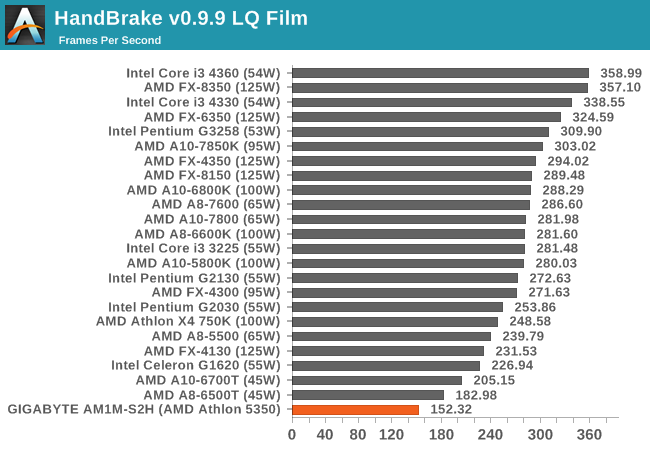
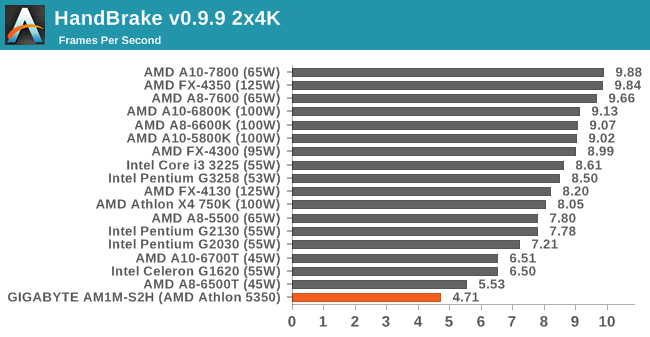
Video Conversion – Handbrake v0.9.9: link
Handbrake is a media conversion tool that was initially designed to help DVD ISOs and Video CDs into more common video formats. The principle today is still the same, primarily as an output for H.264 + AAC/MP3 audio within an MKV container. In our test we use the same videos as in the Xilisoft test, and results are given in frames per second.
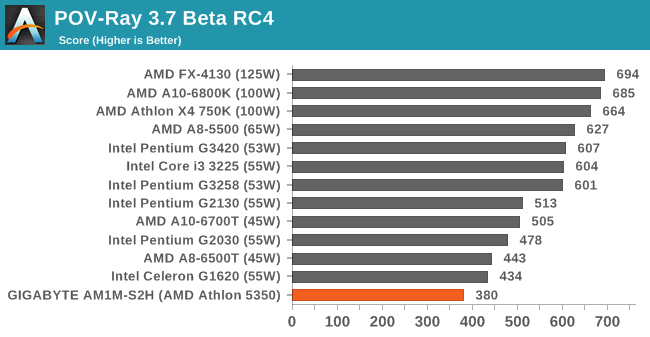
Rendering – PovRay 3.7: link
The Persistence of Vision RayTracer, or PovRay, is a freeware package for as the name suggests, ray tracing. It is a pure renderer, rather than modeling software, but the latest beta version contains a handy benchmark for stressing all processing threads on a platform. We have been using this test in motherboard reviews to test memory stability at various CPU speeds to good effect – if it passes the test, the IMC in the CPU is stable for a given CPU speed. As a CPU test, it runs for approximately 2-3 minutes on high end platforms.
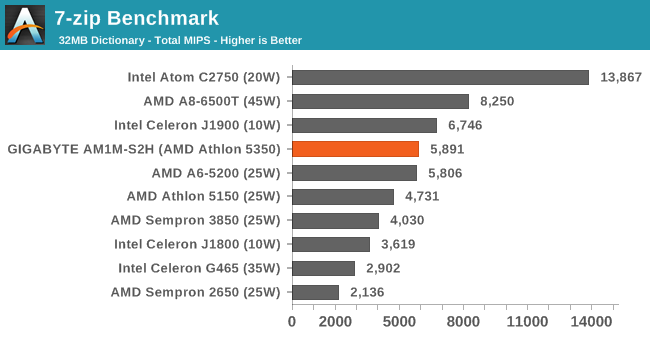
Synthetic – 7-Zip 9.2: link
As an open source compression tool, 7-Zip is a popular tool for making sets of files easier to handle and transfer. The software offers up its own benchmark, to which we report the result.
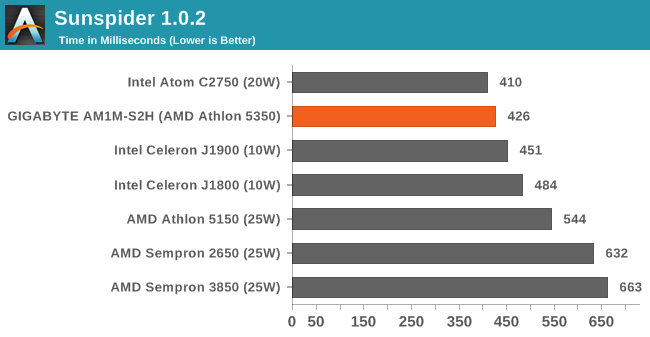
Sunspider 1.0.2
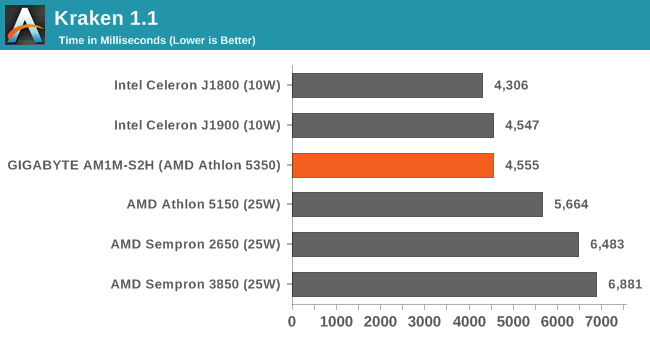
Kraken 1.1
Gaming Benchmarks
While no regular user of the AM1 platform would pair up the system with a $500 GPU, all our results are based on the more mainstream to high end and it is interesting to see if the lack of speed in the lower powered CPU systems makes a significant difference in frame rates.
Also being tested here, aside from the CPU performance effect, is the use of four PCIe lanes from the APU rather than eight or sixteen from the high end platforms. These are also PCIe 2.0 lanes rather than PCIe 3.0, limiting the bandwidth even further.
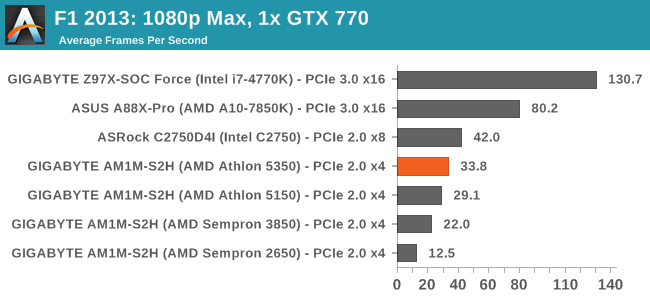
F1 2013
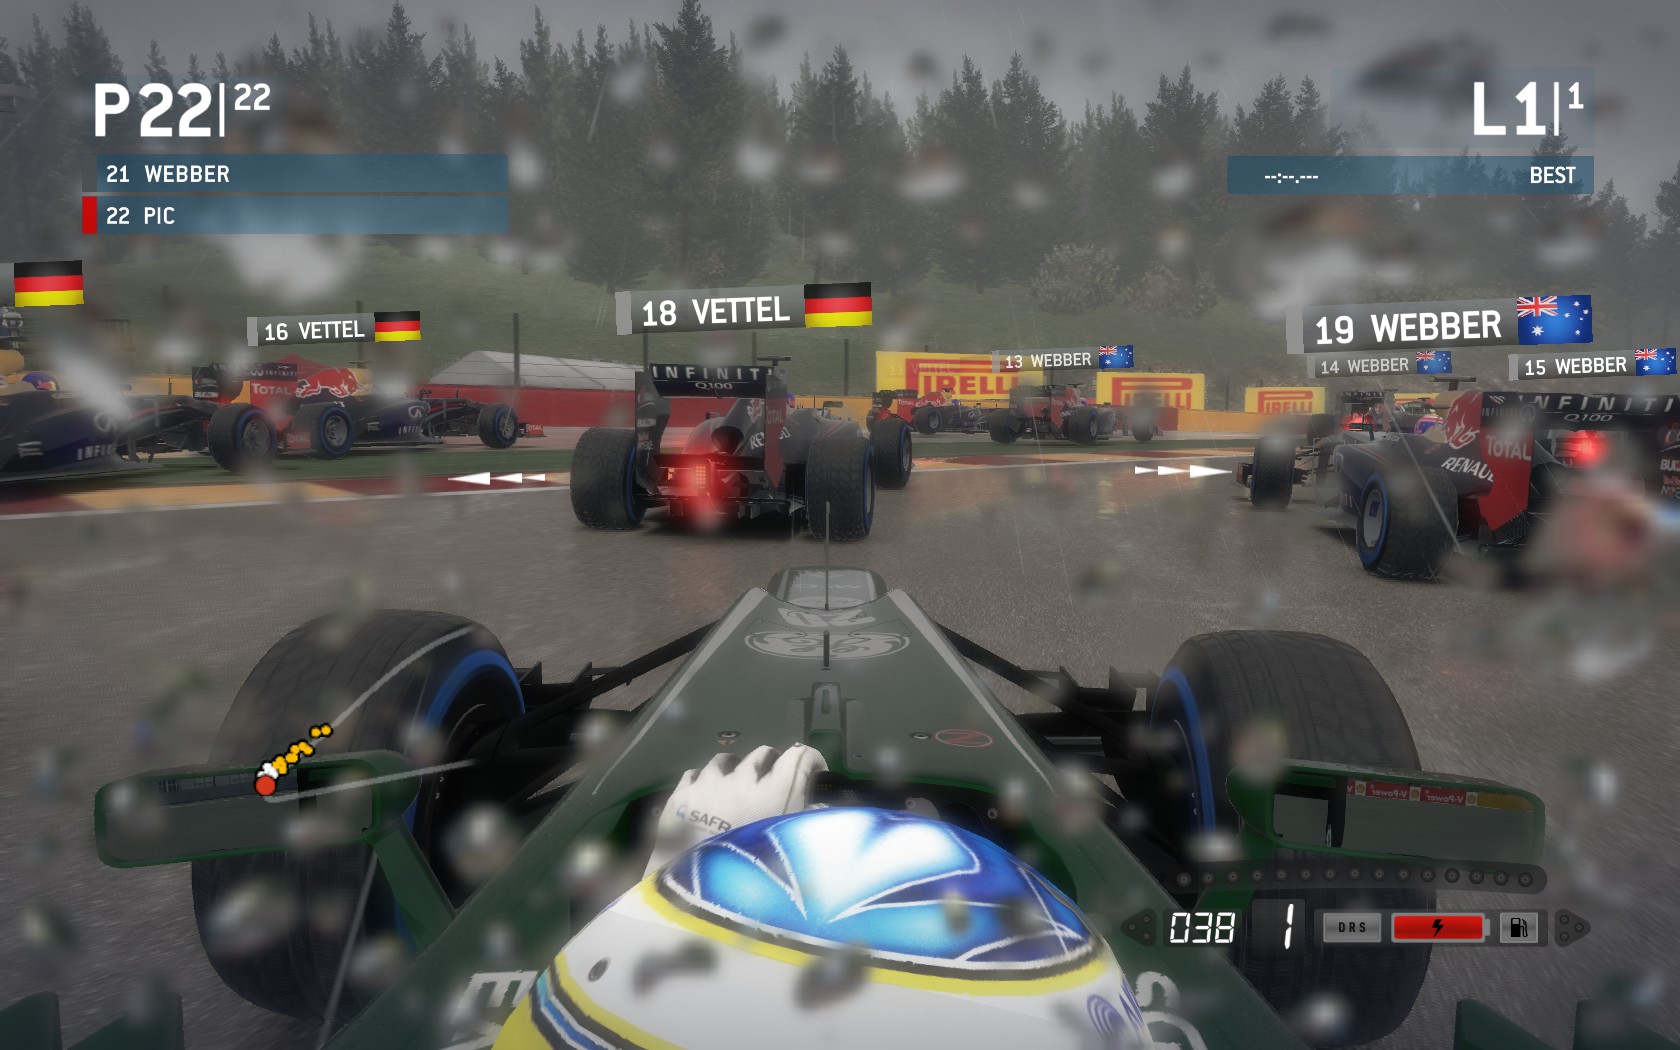
First up is F1 2013 by Codemasters. I am a big Formula 1 fan in my spare time, and nothing makes me happier than carving up the field in a Caterham, waving to the Red Bulls as I drive by (because I play on easy and take shortcuts). F1 2013 uses the EGO Engine, and like other Codemasters games ends up being very playable on old hardware quite easily. In order to beef up the benchmark a bit, we devised the following scenario for the benchmark mode: one lap of Spa-Francorchamps in the heavy wet, the benchmark follows Jenson Button in the McLaren who starts on the grid in 22nd place, with the field made up of 11 Williams cars, 5 Marussia and 5 Caterham in that order. This puts emphasis on the CPU to handle the AI in the wet, and allows for a good amount of overtaking during the automated benchmark. We test at 1920x1080 on Ultra graphical settings.

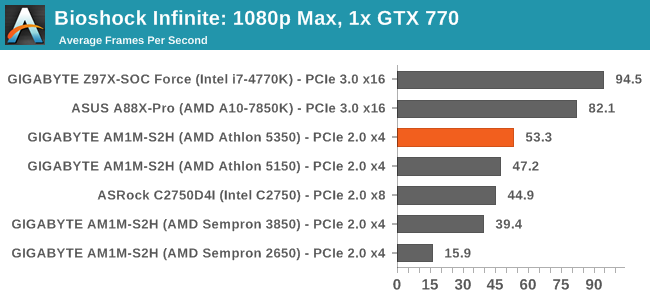
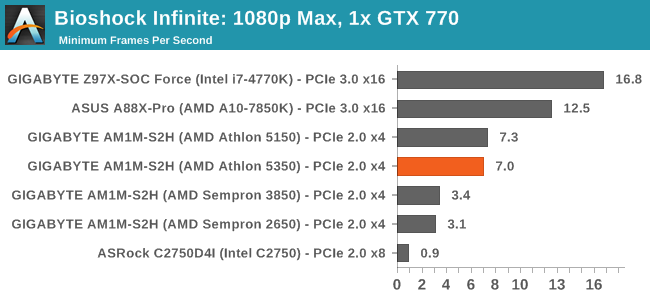
Bioshock Infinite
Bioshock Infinite was Zero Punctuation’s Game of the Year for 2013, uses the Unreal Engine 3, and is designed to scale with both cores and graphical prowess. We test the benchmark using the Adrenaline benchmark tool and the Xtreme (1920x1080, Maximum) performance setting, noting down the average frame rates and the minimum frame rates.

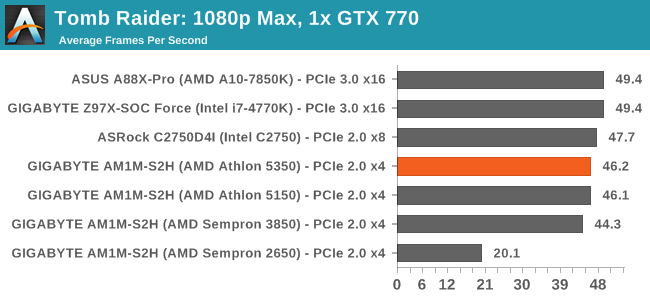
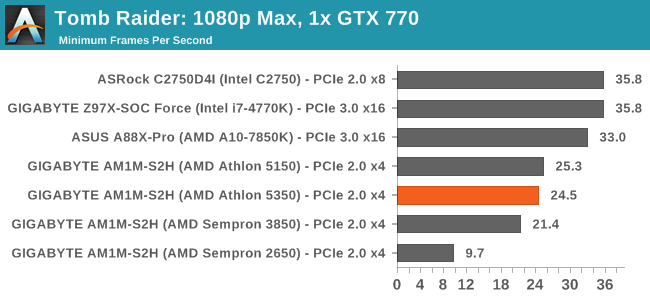
Tomb Raider
The next benchmark in our test is Tomb Raider. Tomb Raider is an AMD optimized game, lauded for its use of TressFX creating dynamic hair to increase the immersion in game. Tomb Raider uses a modified version of the Crystal Engine, and enjoys raw horsepower. We test the benchmark using the Adrenaline benchmark tool and the Xtreme (1920x1080, Maximum) performance setting, noting down the average frame rates and the minimum frame rates.

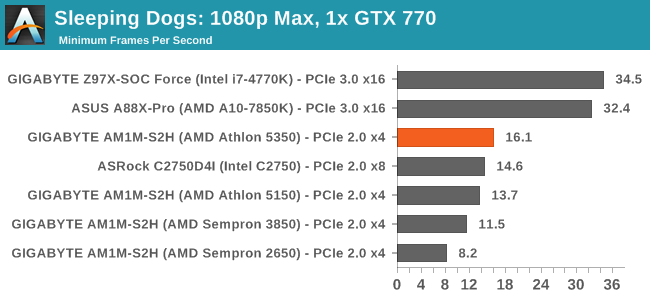
Sleeping Dogs
Sleeping Dogs is a benchmarking wet dream – a highly complex benchmark that can bring the toughest setup and high resolutions down into single figures. Having an extreme SSAO setting can do that, but at the right settings Sleeping Dogs is highly playable and enjoyable. We run the basic benchmark program laid out in the Adrenaline benchmark tool, and the Xtreme (1920x1080, Maximum) performance setting, noting down the average frame rates and the minimum frame rates.


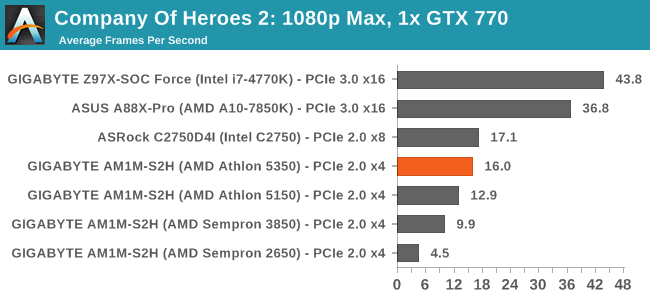
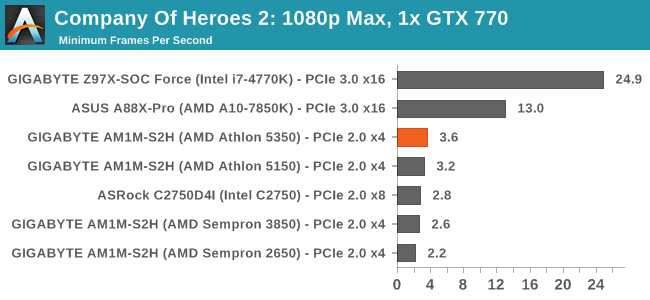
Company of Heroes 2
Company of Heroes 2 also can bring a top end GPU to its knees, even at very basic benchmark settings. To get an average 30 FPS using a normal GPU is a challenge, let alone a minimum frame rate of 30 FPS. For this benchmark I use modified versions of Ryan’s batch files at 1920x1080 on High. COH2 is a little odd in that it does not scale with more GPUs with the drivers we use.
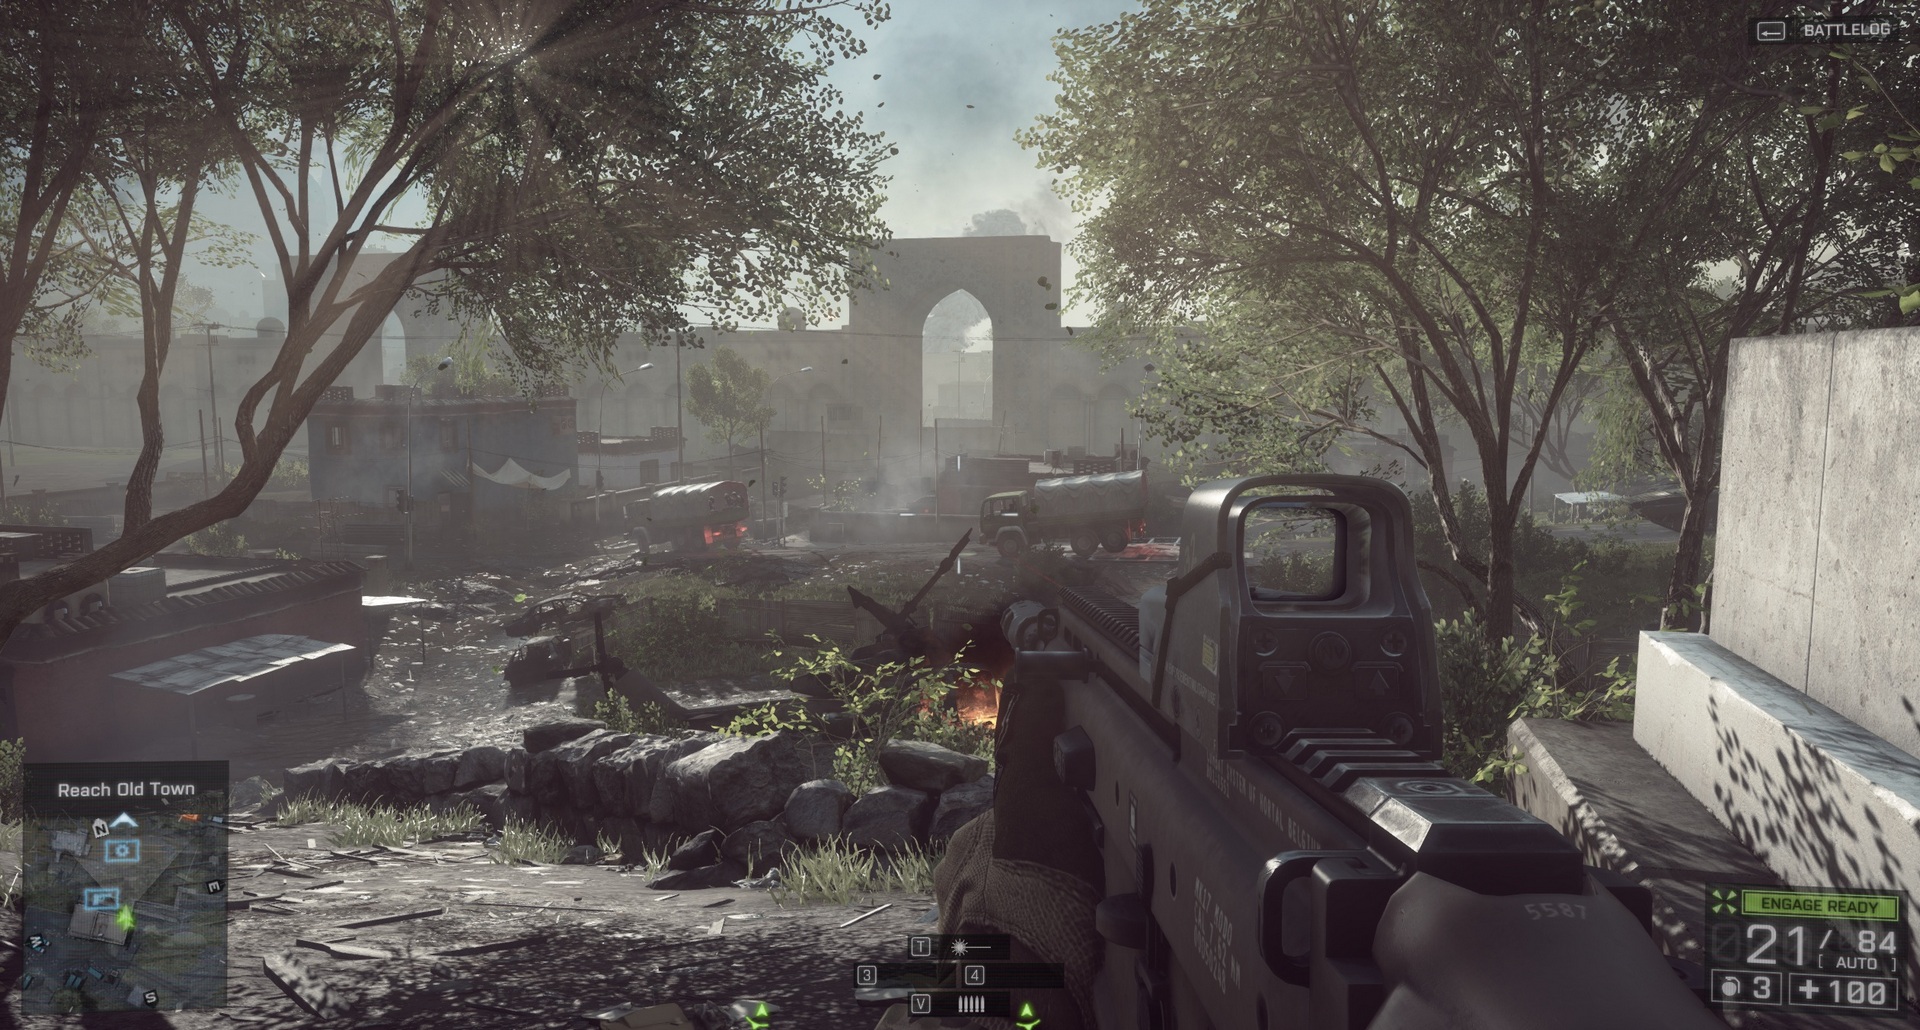
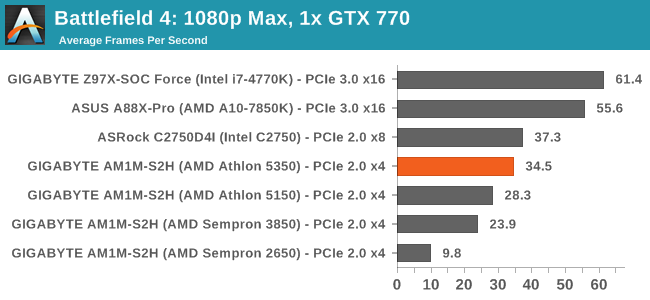
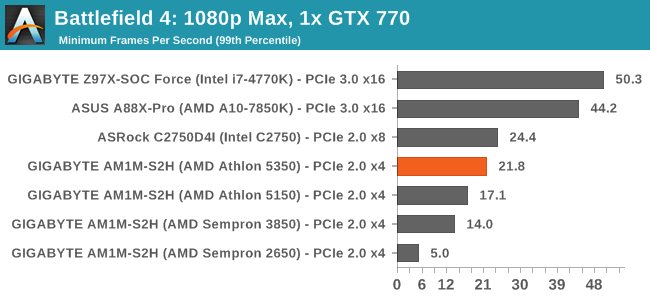
Battlefield 4
The EA/DICE series that has taken countless hours of my life away is back for another iteration, using the Frostbite 3 engine. AMD is also piling its resources into BF4 with the new Mantle API for developers, designed to cut the time required for the CPU to dispatch commands to the graphical sub-system. For our test we use the in-game benchmarking tools and record the frame time for the first ~70 seconds of the Tashgar single player mission, which is an on-rails generation of and rendering of objects and textures. We test at 1920x1080 at Ultra settings.
GIGABYTE AM1M-S2H Conclusion
Low cost, low power motherboards are difficult to conclude. With high end motherboards containing controllers and where we discuss performance, it is easy to rule out $20 of controller improvements for a better overclocking range. But when the whole motherboard is $35, and the motherboard/CPU/DRAM combo for $120 or so, it all comes down to the market.
If we imagine a digital signage seller, in the prototype stage they will buy a set of units in order to design the system. Because the motherboards are cheap, if they accidentally get the wrong one, then buying another is relatively trivial. The same goes for replacement parts: rather than take the time to RMA, it becomes cheaper just to bin and replace where necessary.
The biggest issue for this type of environment for the AM1M-S2H is the position of the SATA ports. Because they are both right in the middle of the motherboard, SATA cables for the hard-drive and ODD have to reach over components to get there. The only way to mitigate this would be to boot from USB, which is not uncommon for digital signage, but what would make that setup better is an onboard USB port akin to some server designs.

In actual fact, I wonder if having an onboard microSD card reader might be more pertinent for this type of platform. Rather than using a bulky SATA device, or relying on a USB that sticks out, how about an onboard microSD card reader that you can install an OS and boot from for the signage. Although the barrier to this, as always, is cost of implementation.
For users looking to build a daily system, without an add-in card you will have to decide between two HDDs or a HDD/ODD combination. The full-length PCIe slot helps if you want to add in more screens or a full-size GPU, although the CPU performance might be the main barrier to doing anything more than web browsing and word processing. One might argue that for GPU compute work, such as some video conversion or rendering, if it can be offloaded onto the GPU effectively with little CPU involvement then it might be worth a shot.
As a motherboard, it worked in our testing and the results are in-line with what we would expect for $35, if not slightly more impressive than we presumed. There are some style changes that I would put forward, especially the SATA port positioning. Unfortunately users have to put up with the older style software. It might help GIGABYTE in the future to develop some base fan control software for any platform to replace EasyTune 6, which might get bundled with the next generation of AM1 (if there is going to be another).


